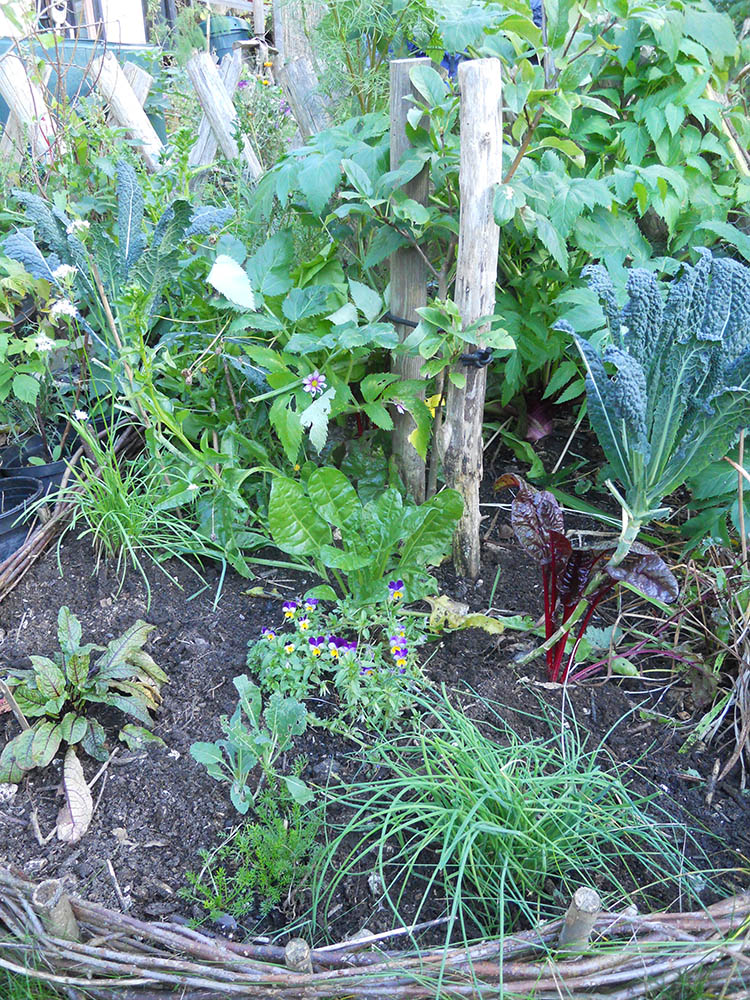
PERMACULTURE DESIGN
I’ve had an interesting enquiry on my Facebook page about how to go through the permaculture design process, which in the most simplistic terms is a way of recording your observations, analysing them, and then deciding what to do next. I find the permaculture design tools so valuable when I have a million and one thoughts rushing through my head, and I need to put them down on paper. This is the way they become ordered and useful. Here’s what I do:
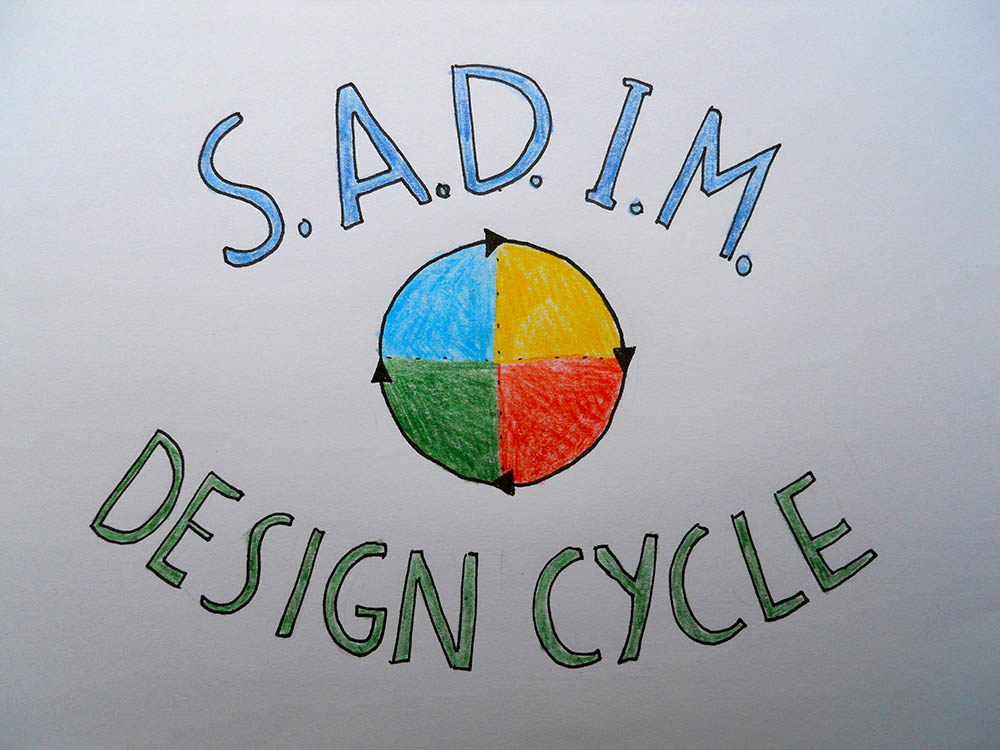 I like to use the S.A.D.I.M. design cycle the most, because it’s simple, I always know which design phase I’m in and it gives structure to an otherwise overwhelming process. I use this for designing ANYTHING, including gardens, my health, rooms in my house, how I’m managing the shopping, literally anything. So here’s what it means:
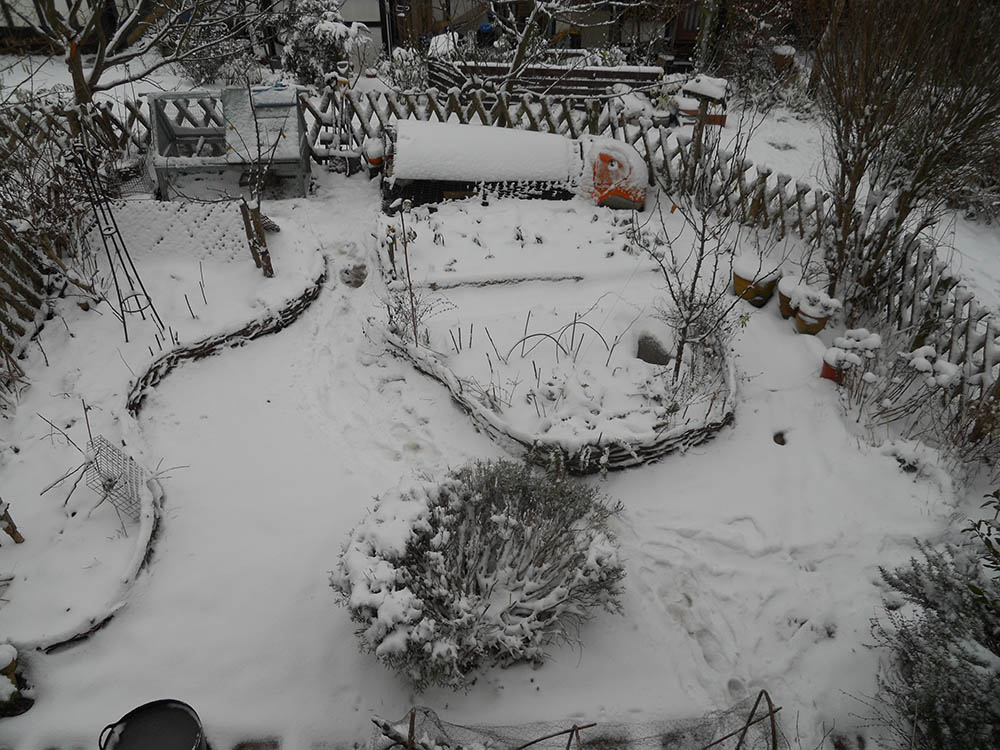
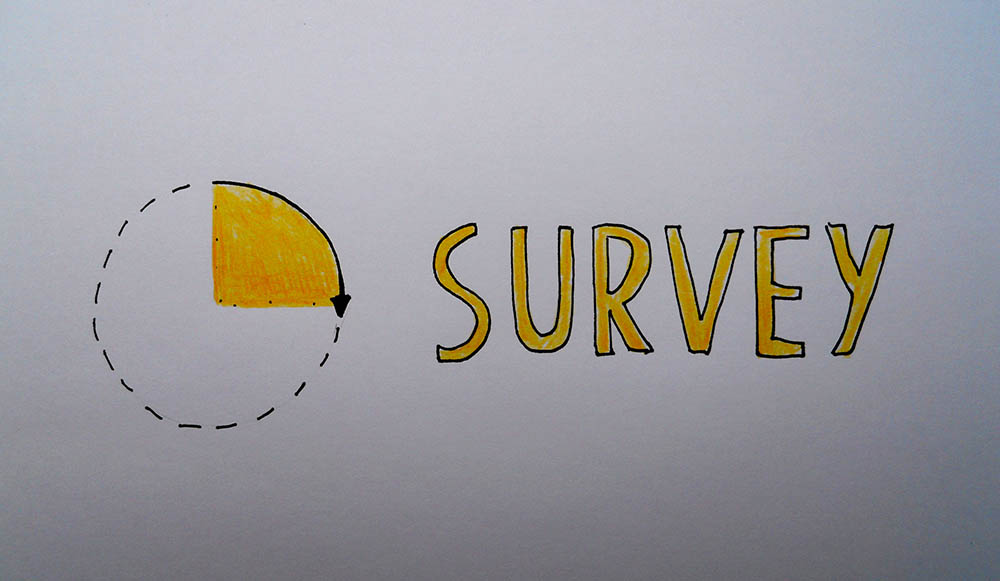 ‘S’ is for SURVEY. It means recording your observations. For a garden this would be creating a base map to scale and recording the sun and shade at different times of day and year, testing the soil, recording the plants already present, and elements such as slope and contours and those that effect the space from the outside such as wind, rain, dogs and cats, wildlife etc. For a personal design such as ‘Optimising your health’, this would mean recording your health (your energy levels, symptoms you might have, what you eat, what the weather is like) over a set period of time, perhaps a couple of times over a year. For this you’ll need to create a kind of data collecting form of your own design, such as the symptom diary I used (see my article in permaculture magazine). Here’s the link: http://www.permaculture.co.uk/articles/optimise-your-health-using-permaculture-design-0
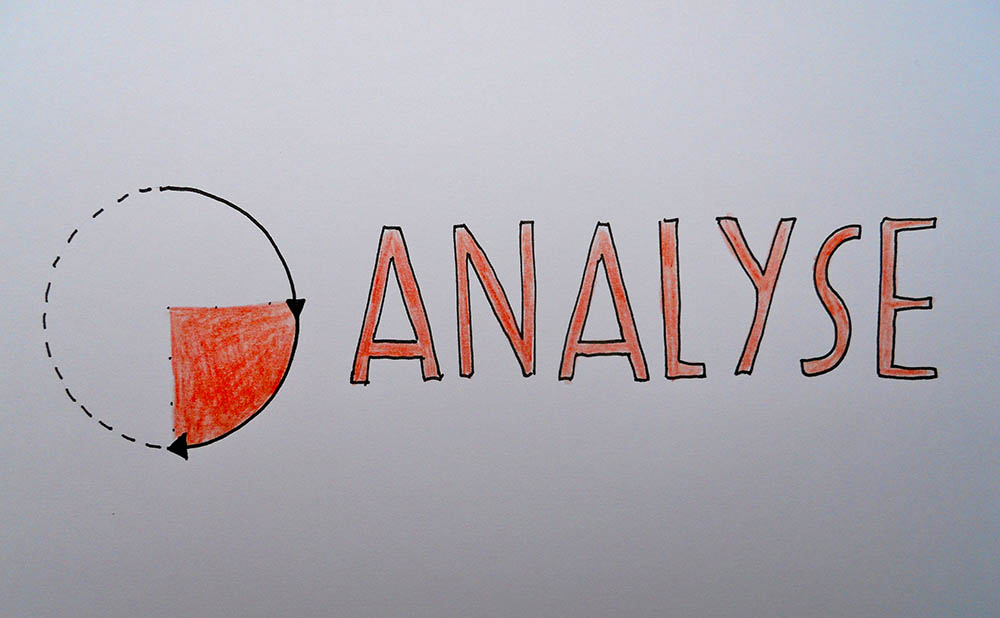 ‘A’ is for ANALYSE. For this I use lots of useful design tools, which help me to pick apart my observations and structure them in a way that makes them easy to refer to in the form of mind maps. My favourites are ‘Plus – Minus – Interesting’, ‘Working – Not Working – Do differently’, and ‘Resources – Invisible structures – Limiting Factors – Design to mitigate limiting factors’.
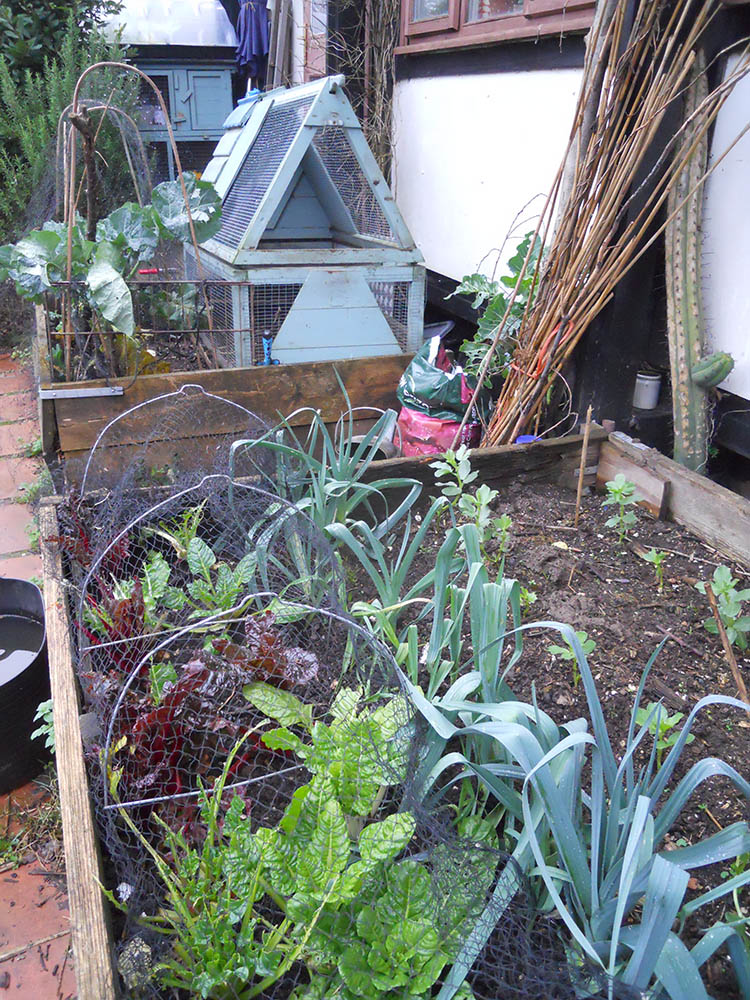
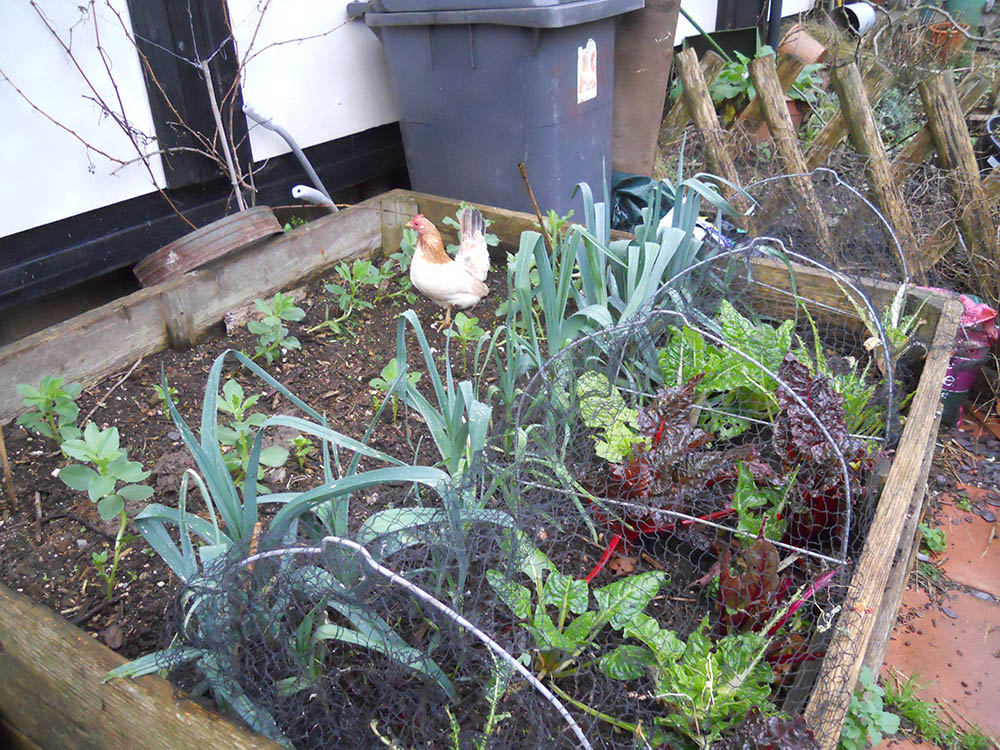
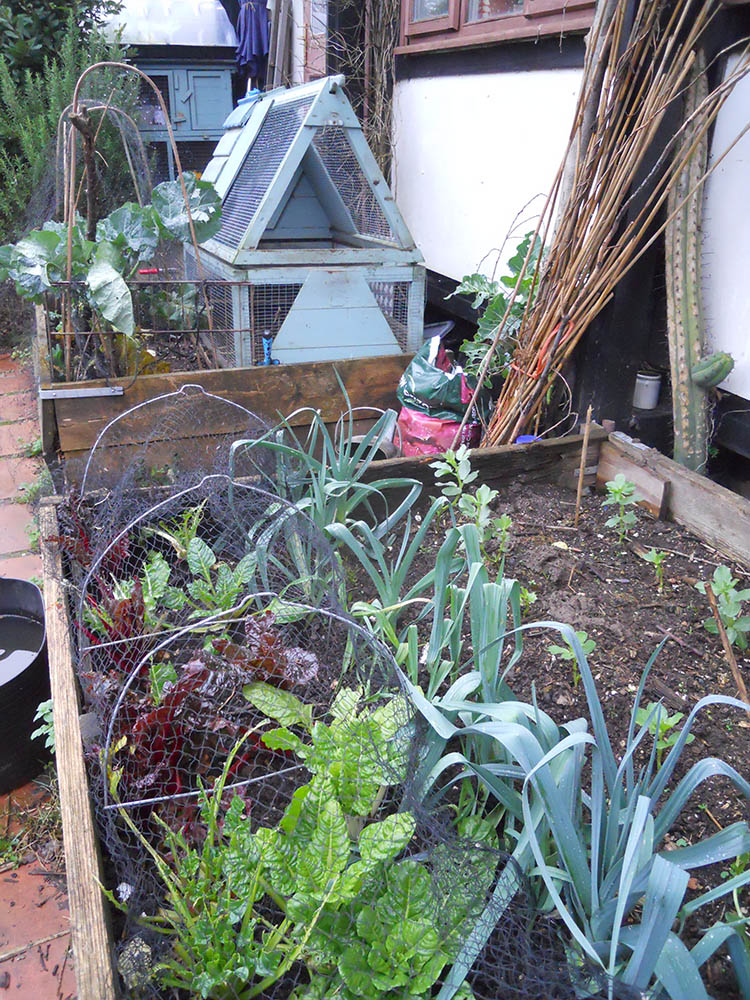
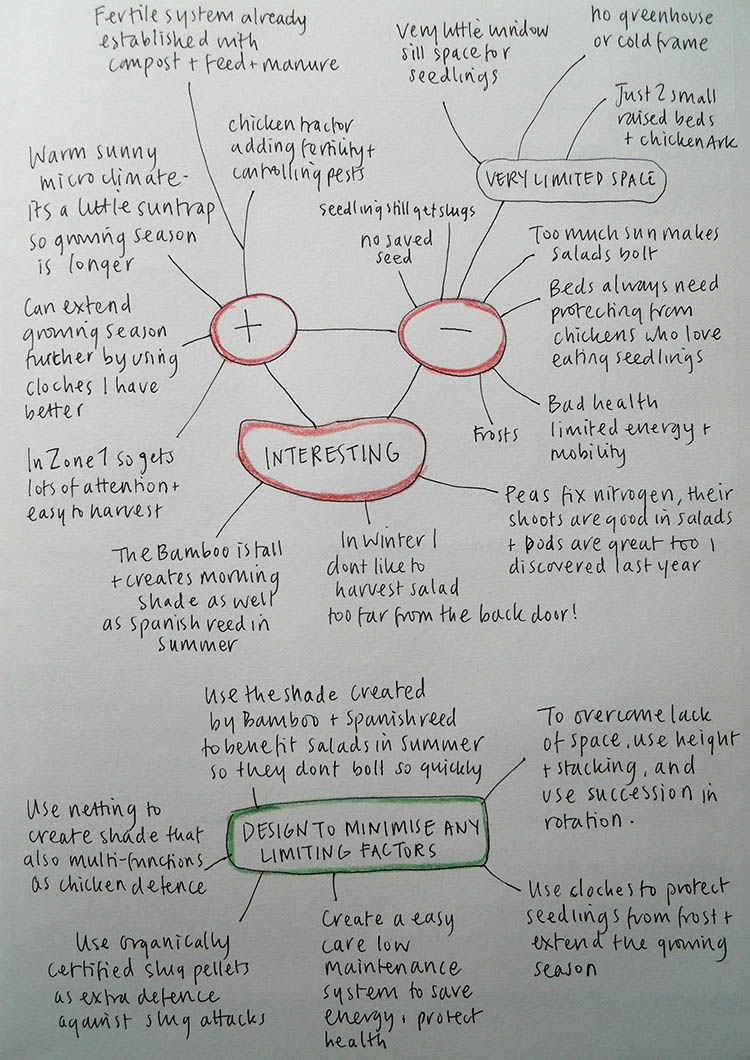 Here’s an example of where I’ve used ‘Plus – Minus – Interesting’ in a design process about growing salads all year round in my garden. Writing all of this down meant that I was able to see the “minus” factors (limiting factors) and problems with the present system, so on the same page I was able to add ‘Design to mitigate the limiting factors’ as a way of problem solving them. I then arrived at some new ideas and how to proceed on with the new design.
 Sometimes we are already mid-way through a project or perhaps maintaining a design, and this is when I like to use the tool ‘Working – Not working – Do differently’. Here’s an example of of where I used it in the ‘Growing salads’ project mid season (i.e..Is the design working so far?). It’s also quite useful when you are working for a client and you are observing what’s currently working for them, and what seems to be not working very well, and then what needs to be done differently usually comes directly and easily out of these observations (with a little imagination!).
In the same way you can create mind maps looking at the resources on site and the client’s personal skills and financial resources, as well as support structures such as friends and family, community centre or local co-op, local services etc. which we call ‘Invisible structures’.
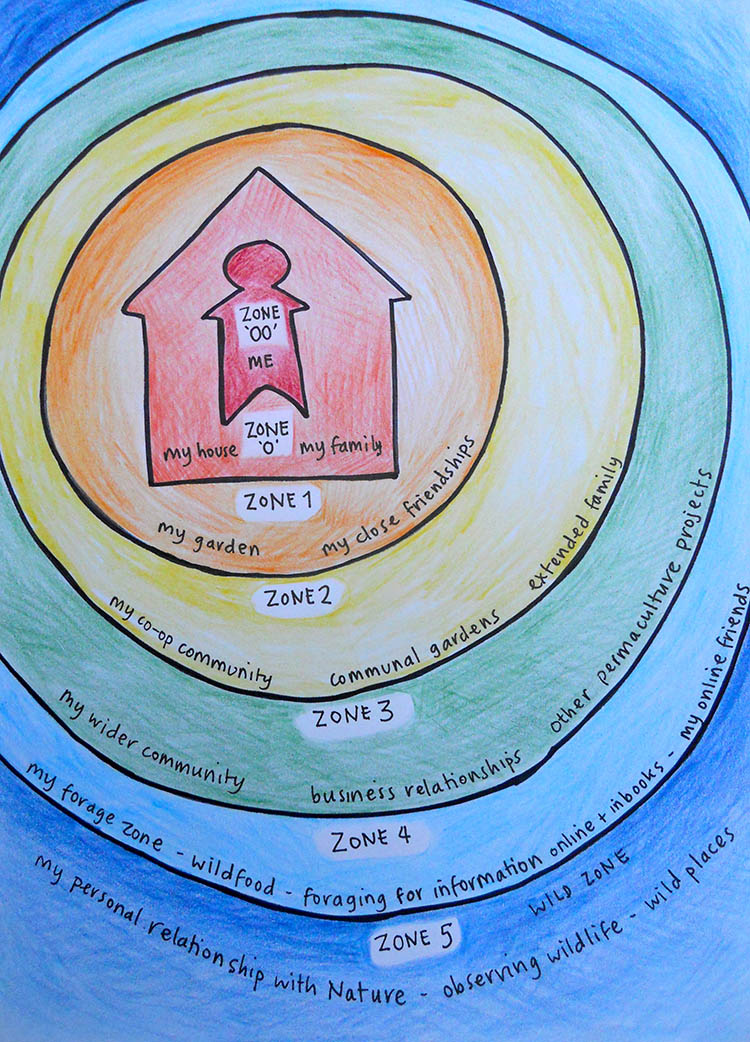 Another important tool is ‘Zoning’. You are the centre of your own part of the universe, so you sit in the middle. This is because in order for your part of the universe to function most efficiently and harmoniously, you need to give the things in the middle the most attention. Each ring or zone that radiates further out from the centre should need less and less attention. Therefore it’s important, in a personal design, to order the demands of your life so that those things that need most attention are sited nearest the middle. So Zone 00 is you in the middle and your relationship with yourself. Zone 0 is inside your house and your relationship with those living with you. Zone 1 might be your garden and close friends and Zone 2 might be your allotment and neighbours in your community, or extended family. Zone 3 might be business relationships and the wider community. Zone 4 could be your friends on Facebook that you rarely see, or foraging in your park or local golf course. Zone 5 is your relationship to nature and wild places.
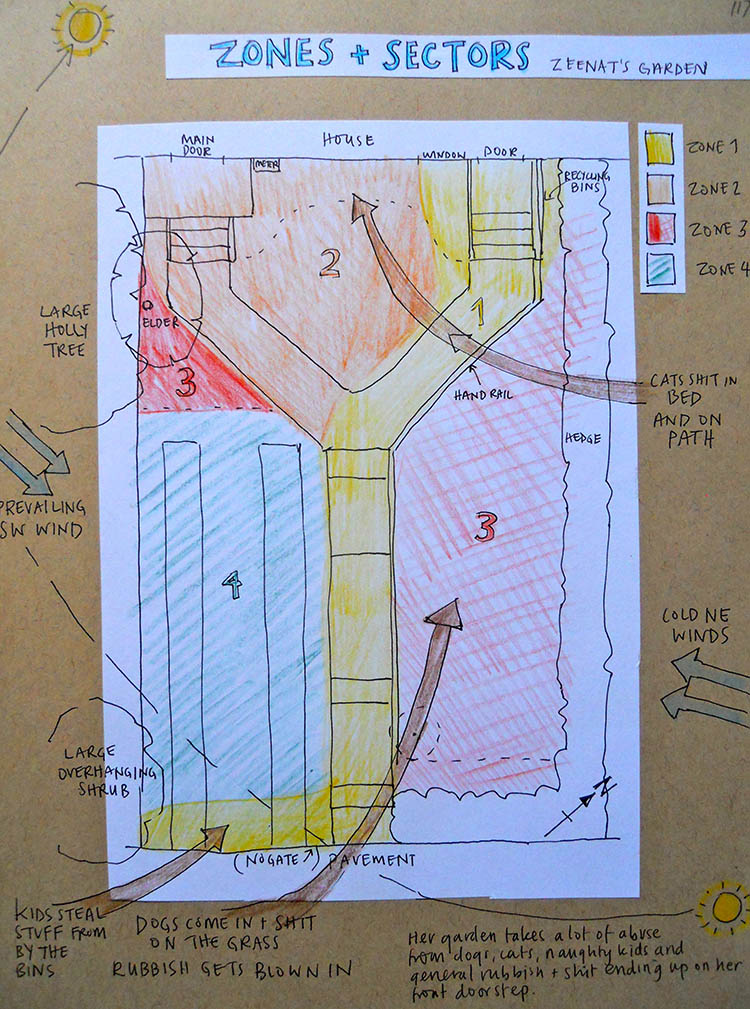 On a land-based design, zoning is about placing the elements of your design in the optimum location, so those things that need the most attention are placed somewhere where they are most likely to get it. For example it’s no use placing salads near the end of the garden where you have to make the effort to walk to them to pick for lunch. If it’s raining you probably would rather not bother. But if you place them near the kitchen door, near your path, you can easily nip out whatever the weather and pick a few leaves, probably noticing any pests that are around too and swiftly picking them off before they eat your lunch before you do! Creating zones helps you to make good decisions about where to put things in your life so that they demand less effort, thus optimising your energy expenditure.
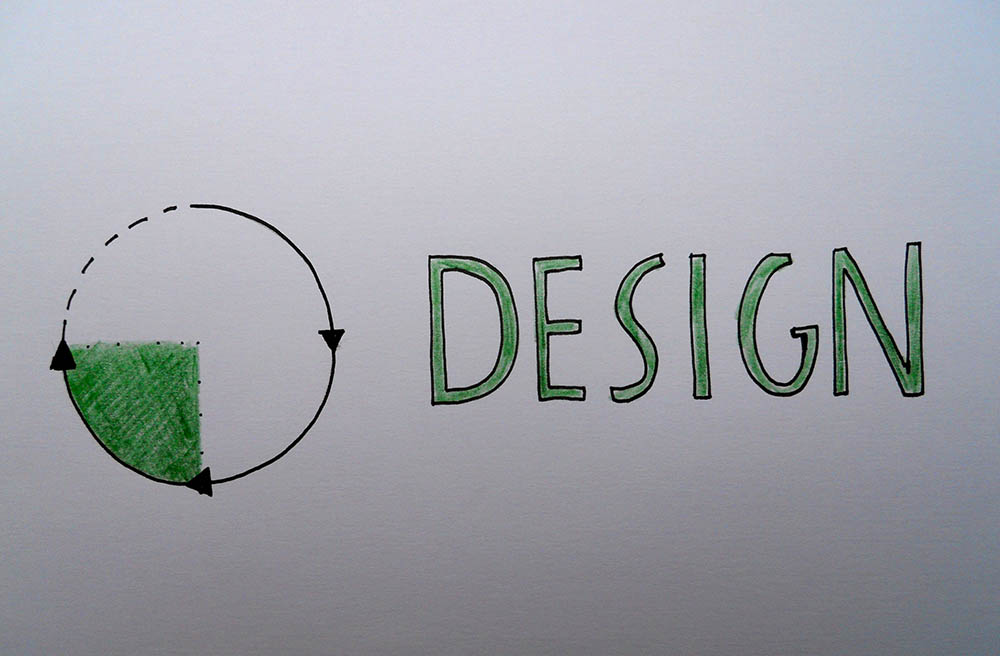 ‘D’ is for DESIGN. Once you have analysed your observations, you will quickly find that the design almost ‘falls out’ of this. The ‘Do differently’ ideas come into play along with your ‘invisible structures’ and ‘resources’. You can ‘design to mitigate the limiting factors’ because you know what those limiting factors are. This is the point where you draw out all your design ideas onto your base map, placing all your elements in their optimum locations according to your zoning data. For a personal design, the design can be as simple as deciding what your goal will be, and creating a flow diagram, a step by step guide to help you get there.
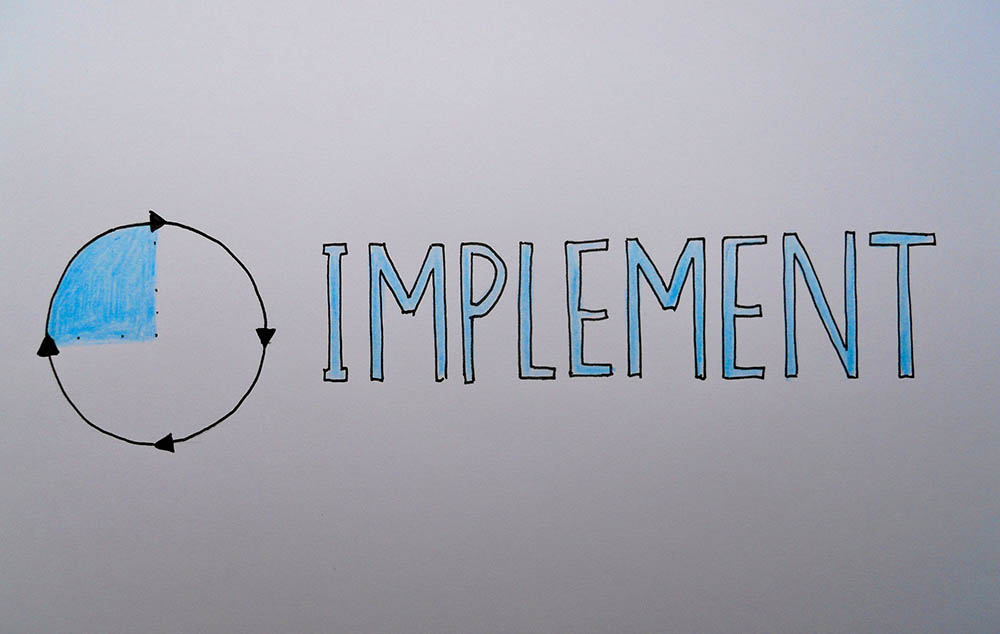 ‘I’ is for IMPLEMENT. This is literally getting on and creating your design on the ground or in your life. It means following your design step by step and seeing it through.
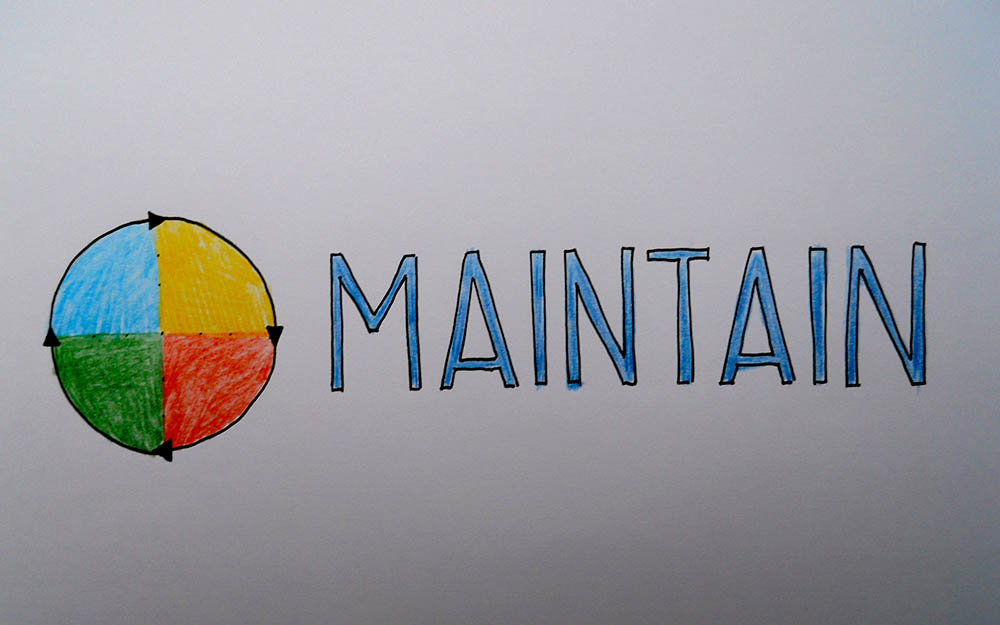 ‘M’ is for MAINTAIN. To maintain your design, you need to occasionally go back through the design cycle again, noticing what’s working, what’s not working so well, and how could I tweak it or do something differently, again, using the analysis tools as described is really helpful. Follow through on your new ‘tweaks’ and again record how it’s working.
So this is the basics of permaculture design in a bit of a nutshell. As you will probably guess, there is far more depth that I could go to, but I don’t want to risk overwhelm. I hope the drawings are helpful and that you now feel you can use the design tools yourself. Mind maps are so useful in helping to get ideas down on paper instead of whizzing around in your head. It doesn’t matter if they are not neat, they can be scribbles on the back of an envelope, but what’s important is that your keep a record of them -I keep all of mine in a scrap book and often refer back to them. So go on… grab yourself a piece of paper and start scribbling your thoughts down! And let me know how you are getting on on my Facebook page: https://www.facebook.com/pages/Flo-Scott-Permaculture-Designs/295271353832624